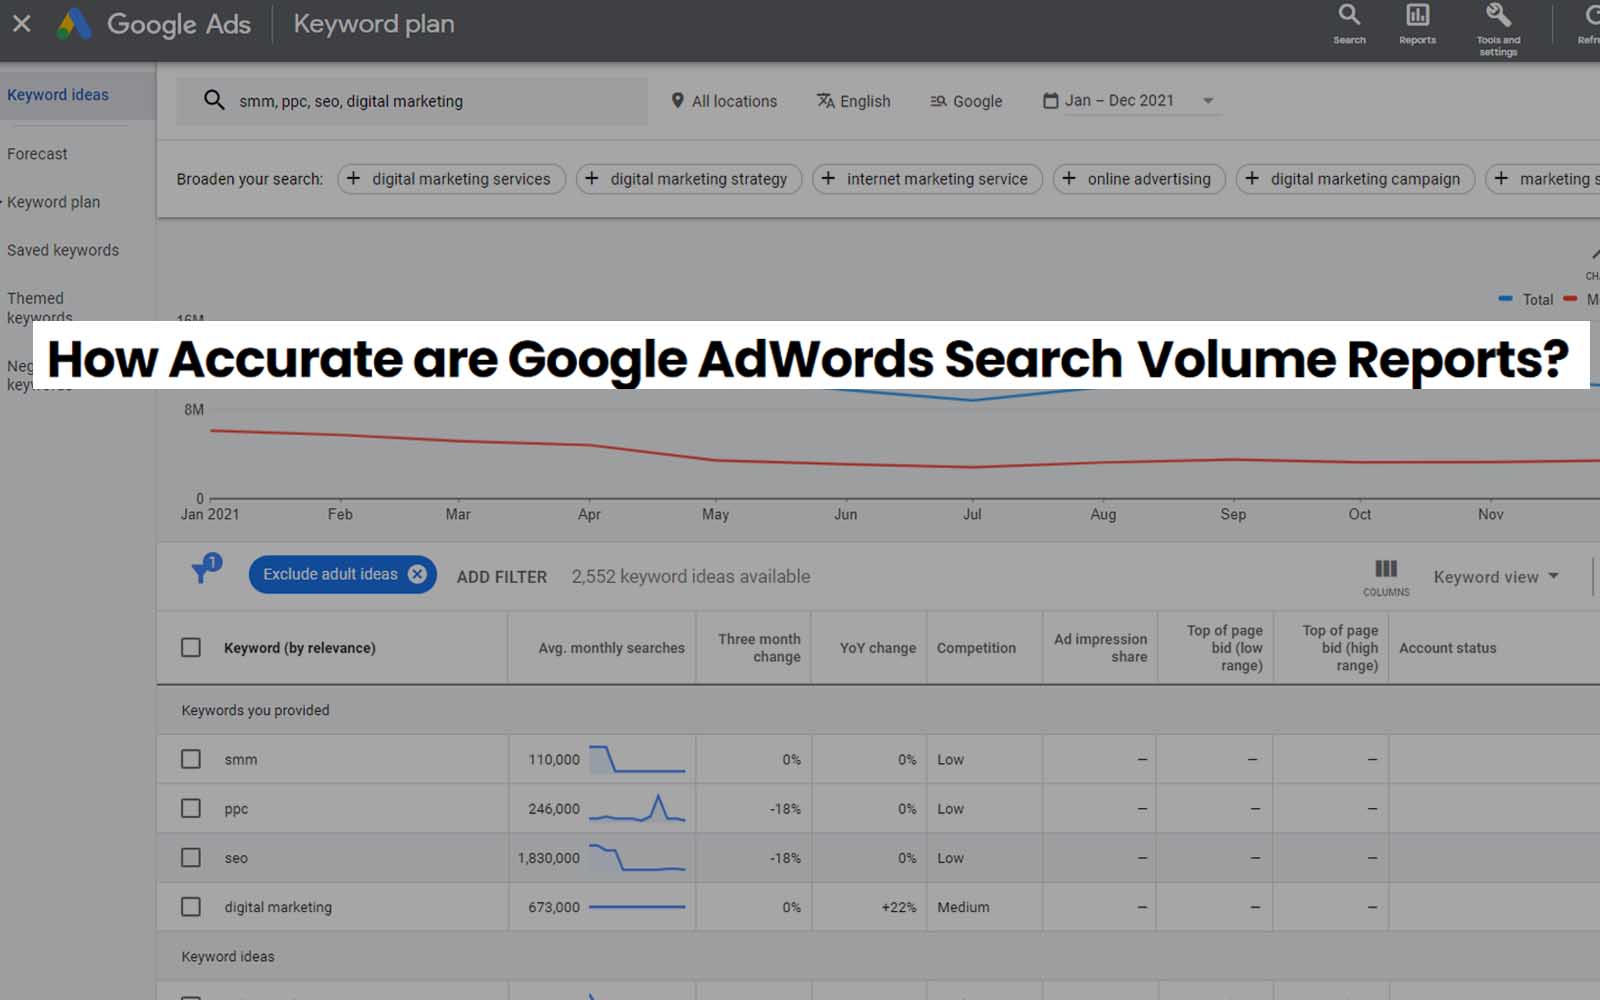
In one of our recent blog posts, we posted an ROI calculator that helps you figure out whether you’re getting enough value from what you spend on SEO by targeting the right keywords. The results were based on an extremely conservative “fudge factor,” or an estimated margin of error, of about 90%, meaning that we only used 10% of given search volumes in our calculations. However, the numbers weren’t all adding up, so we conducted an experiment using several websites. The results showed some rather major discrepancies in the search volume numbers returned by Google AdWords.
Currently, Music.com ranks #2 for the keyword “music” on Google. According to Google AdWords, this should give them a high percentage of the estimated 124,000,000 global searches that Google says occur monthly. Using the belief of Chitika Research Director Daniel Ruby that ranking #2 for a specific keyword will earn you about 17% of all searches (we use 16.96% in the ROI calculator), Music.com should be getting 21,080,000 visits from the keyword music alone per month. This may seem like an attainable goal for a keyword as common as “music,” but based on traffic estimates from Compete.com, the actual number of hits Music.com gets from this keyword is nowhere near 21 million.
So there appear to be three logical explanations for this discrepancy. First, the percentage of a given search you can expect to secure is unrealistically high. Second, the Google AdWords tool is overestimating the monthly global searches. Or thirdly—both are correct. Our initial hypothesis was that the second option was the most likely, given the large amount of research done by Chitika on the traffic percentage of Google’s search results. Our experiment’s procedure looked like this:
Step 1: We identified 4,000 sample keywords from 7 websites which we have Google Analytics data for (Peer1.com, Serverbeach.com, Voxeo.com, Music.com, Brandstack.com, Unbounce.com, and Missionrs.com)
Step 2: We then found the Google rankings for all 4,000 keywords.
Step 3: We then sorted the 4,000 keywords by the best ranking to the worst ranking and narrowed the list down to the words which ranked in the top 10 results (roughly 1,000).
Step 4: For the remaining words, we gathered the individual search volumes (broad, global)
Step 5: Next, we went to each sites respective Google Analytics account and pulled the actual traffic from each keyword.
Step 6: Per each SERP, we took the actual visits and compared that number to how many Chitika’s calculations would project it should get. The percentage of difference between the two numbers is what we call a “fudge factor”, or the percentage that Google AdWords inflates the global search volumes for a given keyword.
The results of the experiment told us two things: firstly, that Google AdWords was significantly overestimating search volumes and secondly, that this overstatement tended to rise exponentially with popularity of a keyword. Looking at the necessary deflation of Google AdWords’ search volumes for the top ten rankings on Google, we found that, on average, AdWords is overstating global search volume by 42.29%. This fudge factor is an important part of our ROI calculator and determining realistic traffic figures. So if, for example, you were to try to target the keyword “cheap dedicated hosting”, it would be wise to apply this 42.29% fudge factor to Google AdWords’ estimate of 8,100 monthly global searches.
So ranking #1 “cheap dedicated hosting” would earn a website 1,606, not 2,782, because of this 42.49% fudge factor. This is demonstrated on the graphic below.
The graph below illustrates our second finding: Google AdWords exponentially overstates search volume as search frequency of keyword increases. The Y-axis shows the true market share of a given keyword by a website which ranks #1 for that keyword and the X-axis show Google AdWord’s estimated volume. As you can see, once the search volume moves past 3,000, it becomes extremely difficult to obtain any sort of significant share of the searches. The market share is certainly nowhere near the 34.45% warranted by ranking #1. The data for the second through tenth position tell a similar story. It seems the only way to obtain a decent percentage of hits for a keyword is to target and rank for moderate keywords. So while a fudge factor of 36.8% is a good average to use, this will typically need to be increased for higher search volume keywords and decreased for lower search volume keywords. You can see from the graph below that, on smaller keywords, the market share is as high as 160%. Obviously, this isn’t accurate either, so while a fudge factor is an important factor in calculating traffic, it is far from an exact tool.
The take-away from this experiment is to exercise caution when targeting a specific rank and market share for keywords if you are relying on Google AdWord’s estimation of search volume. While it may not be an exact figure, we recommend using 42.29% as your fudge factor. This number becomes more subjective when dealing with extremely high or low volume estimations as well. For very large keywords, with volumes of 15,000 or greater, an accurate fudge factor would be about 90% and for smaller keyword, under 1,500 searches, the fudge factor is actually under stated by about 60%. The range on these percentages, although just an estimation, shows the inconsistency of Google AdWords’ estimations. The bottom line is if you’re going to spend a majority of your budget trying to target a specific position for a high traffic keyword, just know that the reward is a slice of a much smaller pie than Google would have you believe.


